
Technology
Fundamentally, OTEC power generation is the same as power generation in
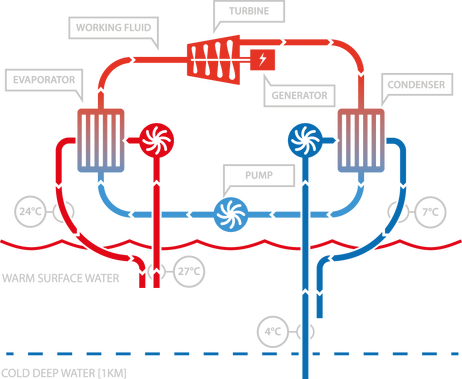
any coal, natural gas boiler, or nuclear power plant; namely, a heat source is used
to boil a working fluid into vapor, which is then expanded through a turbine, and
then re-condensed to begin the cycle again. The difference lies in the magnitude
of the temperature differential between the hot and cold sources. Where fossil fuel
and nuclear boilers create super heated steam at hundreds of degrees Celsius, an
OTEC plant operates on a thermal temperature difference less than that between
the hot and cold water in a typical household sink. This low-grade thermal source is
what makes OTEC unique.
Heat EXCHANGE OTEC system
|
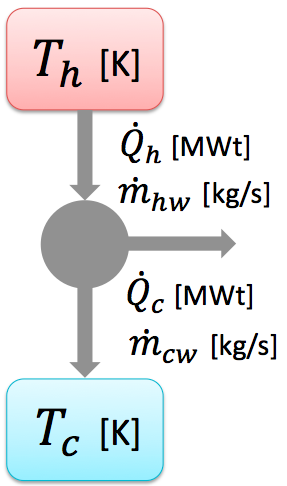
An OTEC system can be described with the Carnot principle. A Carnot engine diagram is shown on the left. An amount of heat QH flows from a high temperature TH (warm surface water) through the fluid of the OTEC systems. The remaining heat QC flows into the surface water Tc, thus forcing the working on the turbine and such generating electricity.
The work is defined as: Where QH and QC are the heat flow for respectively warm surface water and cold deep sea water. The heat flow can be calculated with the following formula:
in which mww is defined as the mass flow, cp as the specific heat coefficient and delta T the temperature difference.
From the above can be concluded that when more electricity has to be produced the difference between QH and QC has to be bigger. Due to physical limitations in the water temperature difference, the mass flow is a leading parameter. When more electricity has to be produced, more water has to be pumped around. |
The temperature-entropy diagram
The behavior of a Carnot system is best understood by using a temperature-entropy diagram (TS diagram), in which the thermodynamic state is specified by a point on a graph with entropy (S) as the horizontal axis and temperature (T) as the vertical axis. See the Figure below for a Carnot Cycle and in the TS - Curve of Ammonia.
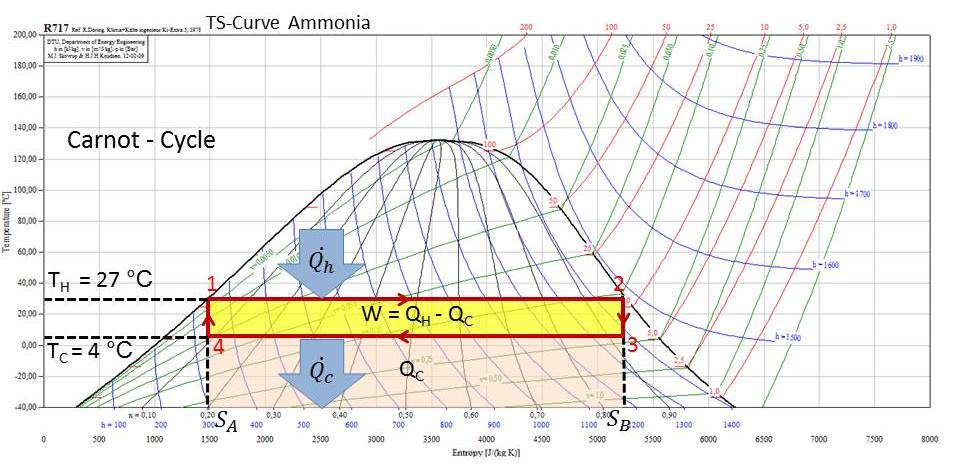
Carnot cycle
The Carnot cycle consists of four steps:
- Isothermal expansion of the gas at the hot temperature. In Figure from point 1 to 2 the gas is allowed to expand and it does work on the surroundings. The temperature of the gas does not change during the process, and thus the expansion is isothermal. The gas expansion is propelled by absorption of heat energy Q'H and of entropy from the high temperature reservoir.
- Isentropic (adiabatic) expansion of the gas (isentropic work output). For this step from point 2 to 3 on the Figure the mechanisms of the engine are assumed to be thermally insulated, thus they neither gain nor lose heat. The gas continues to expand, doing work on the surroundings, and losing an equivalent amount of internal energy. The gas expansion causes it to cool to the cold temperature, Tc. The entropy remains unchanged.
- Isothermal compression of the gas at the cold temperature, Tc. This is from point 3 to 4 in the Figure. Now the surroundings do work on the gas, causing an amount of heat energy Q'c and of entropy to flow out of the gas to the low temperature reservoir.
- Isentropic compression of the gas. In the Figure from point 4 to 1. Once again the mechanisms of the engine are assumed to be thermally insulated. During this step, the surroundings do work on the gas, increasing its internal energy and compressing it, causing the temperature to rise to TH. The entropy remains unchanged. At this point the gas is in the same state as at the start of step 1.
Evaluation of the above integral is particularly simple for the Carnot cycle. The amount of energy transferred as work is
The total amount of thermal energy transferred from the hot reservoir to the system will be
and the total amount of thermal energy transferred from the system to the cold reservoir will be
The theoretical maximum efficiency of the Carnot system is limited. For this OTEC system it can be defined with:
This definition of efficiency makes sense for a heat engine, since it is the fraction of the heat energy extracted from the hot reservoir and converted to mechanical work. A Rankine cycle is usually the practical approximation.
Rankine Cycle
Since here we are
of course not dealing with an ideal heat engine a Rankine cycle is used. The
Rankine cycle closely describes the process by which our steam-operated heat
engine generates power. The heat sources used in this power plant are is in
this case the warm water.
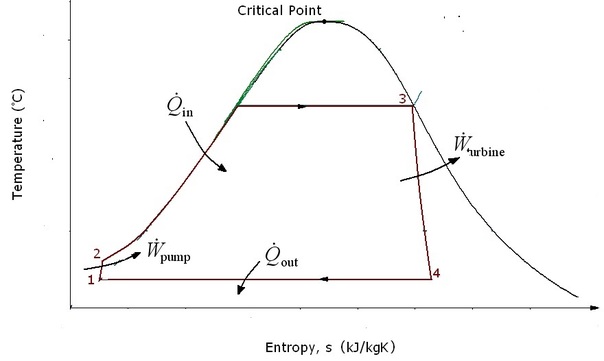
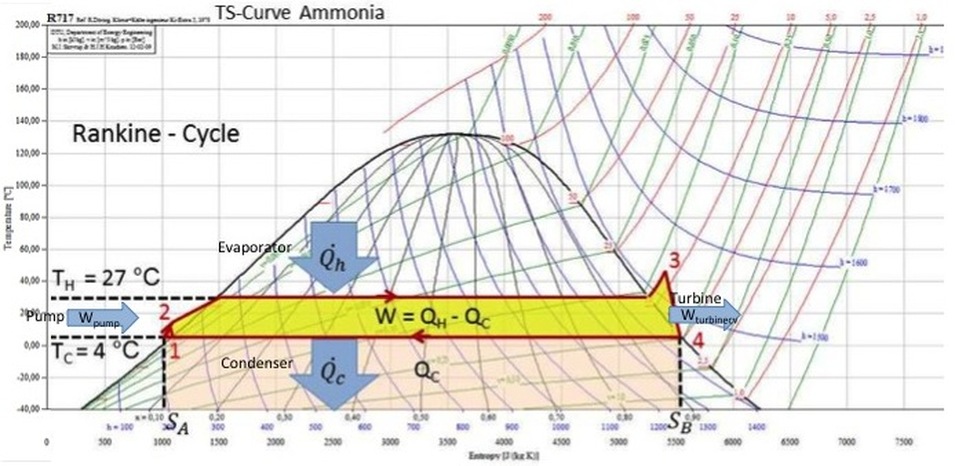
The working fluid (ammonia) in a Rankine cycle follows a closed loop and is reused constantly. The ammonia vapor with condensed droplets are created by the cooling systems and represent the means for waste heat to exit the system, allowing for the addition of (higher temperature) heat that can then be converted to useful work (power). This 'exhaust' heat is represented by the "Qout" flowing out of the lower side of the cycle shown in the T/s diagram below. By condensing the working vapor to a liquid the pressure at the turbine outlet is lowered and the energy required by the feed pump consumes only 1% to 3% of the turbine output power and these factors contribute to a higher efficiency for the cycle.
The working fluid (ammonia) in a Rankine cycle follows a closed loop and is reused constantly. The ammonia vapor with condensed droplets are created by the cooling systems and represent the means for waste heat to exit the system, allowing for the addition of (higher temperature) heat that can then be converted to useful work (power). This 'exhaust' heat is represented by the "Qout" flowing out of the lower side of the cycle shown in the T/s diagram below. By condensing the working vapor to a liquid the pressure at the turbine outlet is lowered and the energy required by the feed pump consumes only 1% to 3% of the turbine output power and these factors contribute to a higher efficiency for the cycle.
|
Four processes Rankine cycle
There are four processes in the Rankine cycle. These states are identified by numbers in the Ts diagram. Process 1-2: The working fluid is pumped from low to high pressure. As the fluid is a liquid at this stage the pump requires little input energy. Process 2-3: The high pressure liquid enters a boiler where it is heated at constant pressure by an external heat source to become a dry saturated vapour. The input energy required can be easily calculated using mollier diagram or h-s chart or enthalpy-entropy chart also known as steam tables. |
|
Process 3-4: The dry saturated vapor expands through a turbine, generating power. This decreases the temperature and pressure of the vapour, and some condensation may occur. The output in this process can be easily calculated using the Enthalpy-entropy chart or the steam tables.
Process 4-1: The wet vapour then enters a condenser where it is condensed at a constant pressure to become a saturated liquid.
Process 4-1: The wet vapour then enters a condenser where it is condensed at a constant pressure to become a saturated liquid.
Real Rankine cycle (non-ideal)
In a real power plant cycle the compression by the pump and the expansion in the turbine are not isentropic. In other words, these processes are non-reversible and entropy is increased during the two processes.
In particular the efficiency of the steam turbine will be limited by water droplet formation. As the water condenses, water droplets hit the turbine blades at high speed causing pitting and erosion, gradually decreasing the life of turbine blades and efficiency of the turbine. The easiest way to overcome this problem is by superheating the steam. On the Ts diagram above, state 3 is above a two phase region of steam and water so after expansion the steam will be very wet. By superheating, state 3 will move to the right of the diagram and hence produce a drier steam after expansion.
Rankine cycle for the case study
Pump calculations
|
A significant
percentage of the energy generated by an OTEC system will be necessary for the
water pumps in the system. Obviously the deep water pumps, which pump the cold
water from 1 km depth, will use a lot of energy. A calculation regarding this
pump power will be demonstrated below.
The net power is defined as follows:
The gross power in
this system Is 1 MWe. The realistic gross efficiency is 3 % In order to calculate the pump energy consumption the
inlet loss, the friction loss, the hydrostatic head and the heat exchanger will
be calculated. The total head these components will generate will be the
necessary pump power needed.
|
|
|
|
The inlet loss can be calculated with the inlet head:
Now use that at 10 m
water depth the pressure will be around 1 bar.
The friction loss is defined as follows: With L is the pipe length [m], D is de pipe diameter [m], V the flow velocity [m/s], rho is the density in [kg/m^3]. The coefficient f is calculated with:
Where Re is the Reynolds number:
The hydrostatic pressure is given as:
The power which is needed for the cold water pump can now be calculated using the volume flow, the density of the cold water, the pump efficiency and the total head.
|
